
In heat treatment processes, we often hear statements like:
“This steel grade needs to be quenched quickly,” or
“If this is cooled too rapidly, it will crack.”
However, the key factor that truly determines heat treatment quality is not simply the cooling rate itself,
but the pattern of cooling—namely, the cooling curve of the quenching oil.
Heat treatment quality is determined not by how fast the material is cooled, but by how it is cooled.
Even when heat treatment conditions appear to be the same on the surface, differences in hardness, microstructure, distortion, or crack formation often originate from differences in the cooling curve of the quenching oil.
What Is a Cooling Curve?
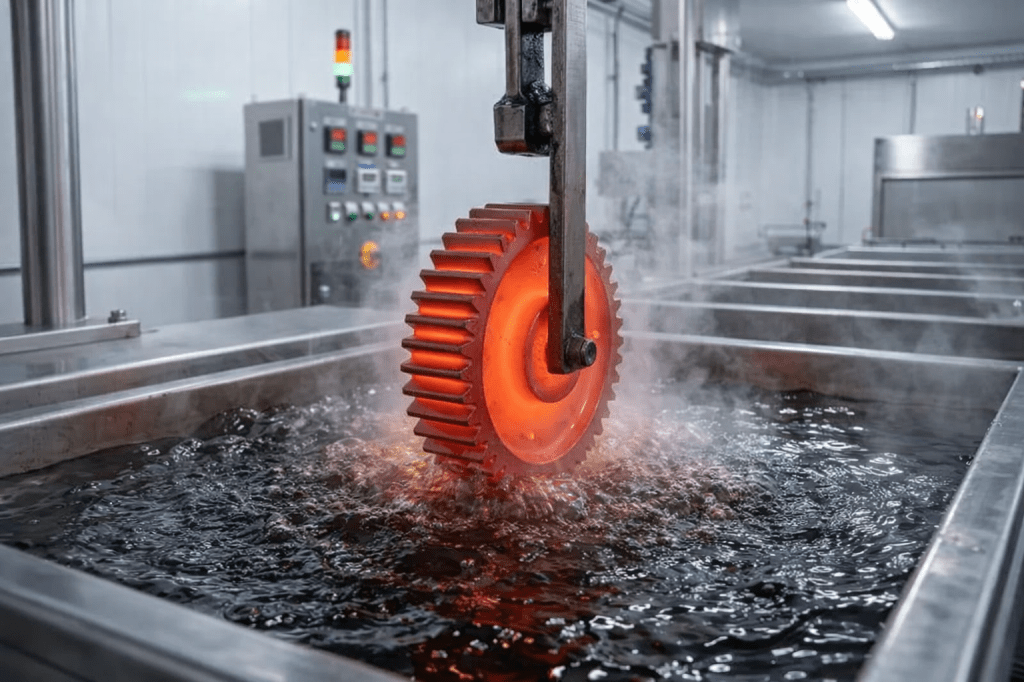
A cooling curve is a graph that shows how the temperature of a metal decreases over time when a metal heated to a high temperature is immersed in quenching oil during heat treatment.
This curve is not a single straight line; it is typically composed of the following three cooling stages.
① Vapor Phase
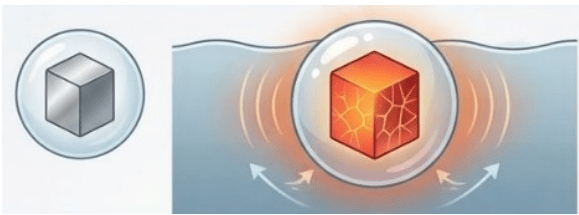
In this stage, cooling proceeds slowly through radiation and conduction, and a vapor blanket forms on the metal surface immediately upon immersion.
Heat transfer is most unstable during this phase, and if this stage is prolonged, cooling non-uniformity may occur, potentially leading to the formation of soft and undesirable pearlite instead of martensite.
② Boiling Phase
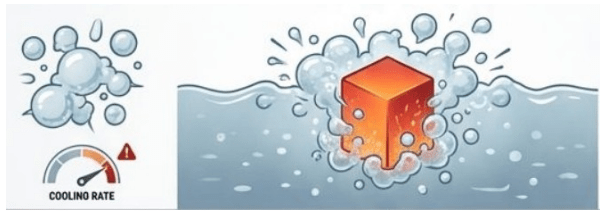
This is the stage in which rapid heat removal occurs as the vapor blanket collapses, and it is the most critical phase for hardness development.
If cooling is excessively rapid during this stage, the risk of crack formation may increase.
It is the key zone where intense heat transfer takes place, and the maximum cooling rate appears during the formation and detachment of bubbles.
This stage is also decisive for forming a hard martensitic microstructure, making precise control of the cooling rate essential.
③ Convection Phase
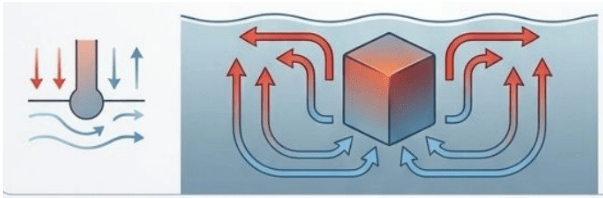
Cooling proceeds via natural convection or forced convection, and the cooling rate is influenced by viscosity and agitation conditions (flow conditions).
In this stage, the temperature gradually decreases, resulting in gentle cooling, and this is the phase that affects product deformation and the formation of residual stresses.
In summary, the three stages of the cooling curve are as follows:
| Stage | Cooling rate | Primary objective |
| Vapor Blanket | Slow | Initial quenching stabilization |
| Boiling Stage | Maximum (critical zone) | Martensite formation |
| Convection Stage | Relatively slow | Final cooling control |
For each heat treatment oil, the proportions of these three stages and the transition speeds between them differ, and this difference is precisely what is referred to as the difference in cooling curves.
Why Is the Cooling Curve Important?
1. Hardness and Microstructure Are Determined by the Cooling Curve
Microstructural transformations in steel—such as martensite and bainite—depend on how quickly and stably specific temperature ranges are passed through.
- Cooling too slowly → Failure to achieve target hardness
- Cooling too rapidly → Excessive martensite formation, increased brittleness
- Large cooling variations → Non-uniform hardness
In other words, what matters is not a “fast oil,” but an oil with an appropriately controlled cooling curve.
2. Deformation and Warping Are Caused by Cooling Imbalance
Distortion issues, which are common in large or geometrically complex parts, are also closely related to the cooling curve.
- An unstable vapor blanket stage
- Large differences in local cooling rates
- Resulting thermal stress imbalance → Deformation
👉 Heat treatment oils with stable vapor blanket breakdown characteristics are advantageous for reducing distortion.
3. Cracks Can Occur Even with “Excessively Good” Cooling
“We achieved the required hardness, but cracks occurred.”
In many such cases, the answer can be found by examining the cooling curve.
- Excessively rapid cooling during the boiling stage
- Abrupt temperature drops in specific temperature ranges
- Internal stresses exceeding material tolerance → Cracking
👉 Even oils with high cooling performance can cause defects if the cooling curve is too aggressive.
4. Why Results Differ Under the Same Conditions
If results differ despite using the same equipment, steel grade, and process conditions, the cause is often the degradation state of the heat treatment oil.
- Oxidation → Changes in the cooling curve
- Sludge formation → Instability in the vapor blanket stage
- Viscosity change → Reduced cooling efficiency in the convection stage
In other words, as heat treatment oil ages, the cooling curve itself changes, making regular oil monitoring and analysis essential.
What Defines a Good Heat Treatment Oil?
A good heat treatment oil is not simply one that cools quickly.
It is an oil that:
- Has a short and stable vapor blanket stage
- Provides a controlled boiling stage
- Delivers uniform cooling performance during the convection stage
In short, a good heat treatment oil possesses an ideal cooling curve tailored to the process objective.
That is why, when selecting a heat treatment oil, cooling curve data must be reviewed alongside viscosity and flash point.
The Solution Proposed by DynaSolution
DynaSolution approaches heat treatment not as a simple matter of oil selection, but as a cooling curve design challenge.
Through cooling-curve-data-based analysis tailored to specific process conditions and material characteristics, we deliver stable and highly reproducible cooling performance across the vapor blanket, boiling, and convection stages.
A heat treatment oil defined not merely by “cooling performance,” but by a cooling curve optimized for the process—that is the standard DynaSolution pursues.
If you want to elevate your heat treatment quality to the next level, start by examining the cooling curve.
DynaSolution is ready to work with you to find the answer.
Dyna Co., Ltd.
Industrial Lubricant Solution
E-Mail : dyna@dynachem.co.kr
Web : dyna.co.kr/en/


댓글 남기기